Sourcing & Processing Data for 360-Degree Visualisation of Service Health
- By David Arrowsmith
- •
- 14 Aug, 2018
- •
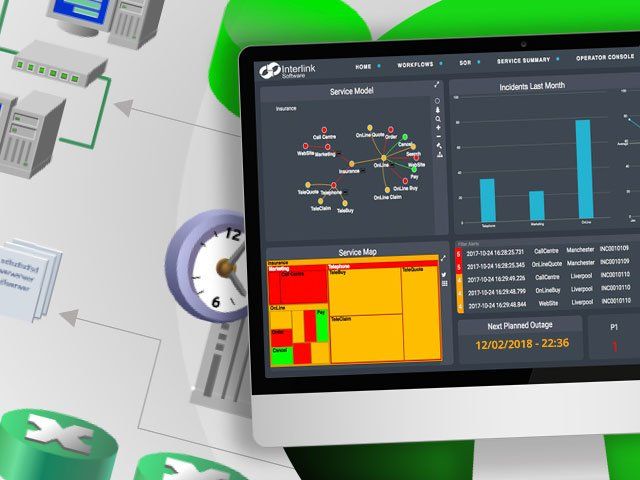
Mike Smith, Senior Software Consultant at Interlink Software discusses how bringing together a broader range of insights, metrics, availability and performance data can help avoid service interruption and aid IT/business alignment.

For us, aligning IT with the business has always been data-driven. It’s the power to deliver insight and understand the business impact of any potential service interruption.
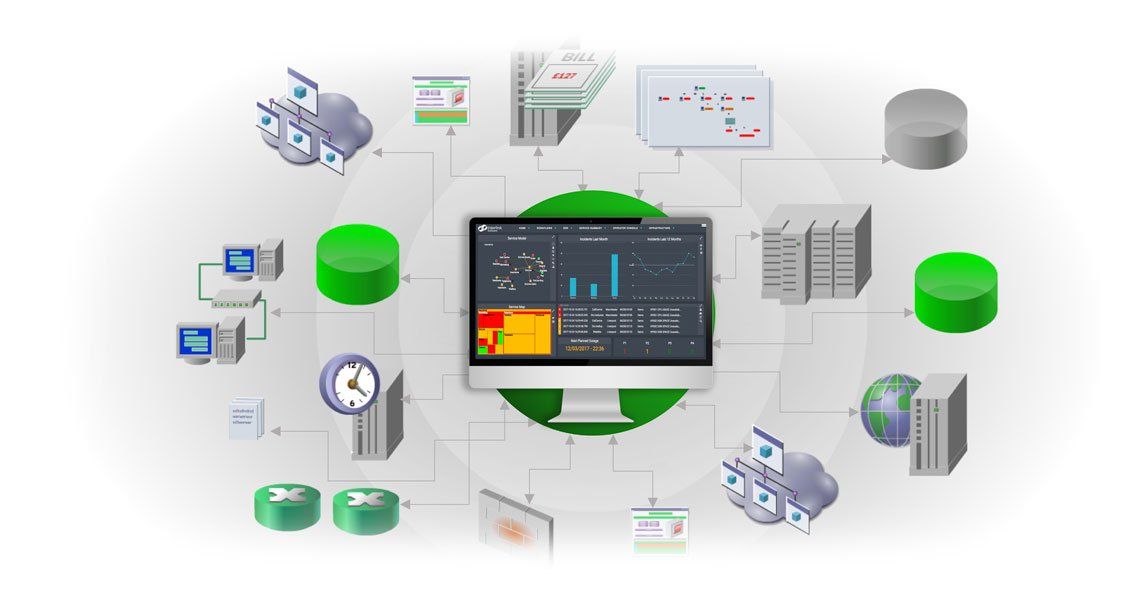
We’ve been working to extend our reach and take in data from integrations with a wider range of management tools – achieving more of a 360-degree approach to visualising service health.
Manager of Managers (MoM) remains our cross-enterprise technical alert and event management hub – monitoring from the inside-out.
We’re putting increased emphasis on metrics to bring IT Ops a richer range of insights by which to view service health – from the outside-in.
We’re bringing in other important insights from performance, availability, end-user and security perspectives. Integrations to tools like DCRUM and AppDynamics for application delivery chain performance, SiteConfidence – testing user journeys externally through websites. We’re also looking at database queries for operational data from sources like SCOM and pulling data in from ITSM tools like ServiceNow.
What this allows organisations to do is to see the real-time impact of infrastructure events on customer experience and more efficiently allocate resource to the customer impacting issues – rather than dealing with the system that is shouting the loudest.
These inside-out / outside-in perspectives enable the monitoring of trends from different angles. Everything meets in the middle – correlating back to the MoM and the service model.
Using Data Manager, we’re processing metrics to identify deviations from a baseline – performing predictive calculations to display trending, creating threshold breach alerts so IT Ops can act to avoid issues.

Get in touch HERE to book a live demonstration.
Mike has 37 years’ experience in the infrastructure and network management field. Before joining us, he was Service Owner for all aspects of Enterprise / Network Management at SSE Enterprise Telecoms.
More from Mike

Adam Smith , Senior Pre-Sales Engineer, Interlink Software, talks through the tried and trusted approach we take when implementing Single Pane of Glass Service Health Dashboards.
Moving to Single Pane of Glass service health monitoring, getting away from reactive, technology/component-based service health monitoring to a proactive, predictive approach is a new way of working for most of our new customers. (Watch a brief video about how Nationwide Building Society did it HERE.)
Onboarding a new customer and deploying accurate, meaningful dashboards is NOT just about the technology. People make it happen!
And as a project lead it’s my job to work effectively with everyone involved and bring all the information together that we need to bring their dashboards to life.
Grant Glading, Head of Sales and Marketing at Interlink Software talks about lessons to be taken from IT monitoring history and Single Pane of Glass views …
